
.
My Spreadsheet
Well this is exciting!
There would be no point in me just writing about all of these skills for excel if I wasn’t going to use any of them so… I’M CREATING MY OWN SPREADSHEET! 😀 I am super excited because I can put all of this knowledge to practical use.
I wanted to do my spreadsheet about something I love so it would be interesting to me and I thought: Board Games! I love playing (and making) board games so it would be the perfect topic for my spreadsheet.
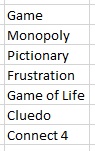
To start off with, I thought of 6 popular board games:
- Monopoly
- Pictionary
- Frustration
- Game of Life
- Cluedo
- Connect Four
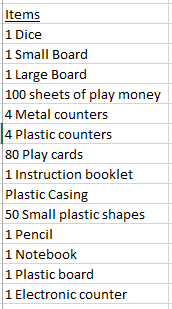
I then needed to work out the cost (using my estimated costs of each individual item) in order to work out the profit. To do this, I listed all of the items needed for all of the games in a column
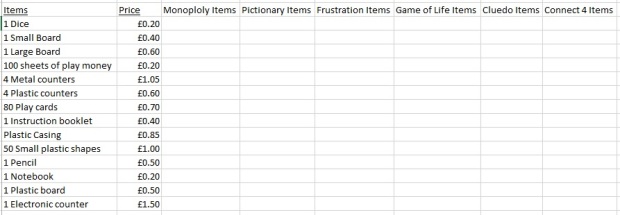
Then, in the next column, I typed a heading ‘Price’ and estimated how much each item/items would cost. My estimates were probably higher than the actual cost however I wanted some decent figures to work with.

As you can see, all the numbers in the price column have pound signs in front of them. It may seem a silly thing to point out but there is a very easy way to make sure that a number has a pound sign in front of it. Rather then having to press shift > 3 every time you need a pound sign, highlight all of the cells in which you want pound signs. Look at the home tool bar and find the box which says ‘General’.

Next click on the little arrow which should bring up a drop down menu. Click ‘currency’ on the menu and the cells you have highlighted should now be in pounds. This is a really useful function to know about when using excel.
After that, I started to create a table by adding the board game names in a row along the top of my spreadsheet.
I could then go down the ‘Monopoly Items’ column and type in how many of each item were needed for the game…

To work out how much it would cost to make the game, I had to then type in quite a long formula. I needed to multiply the price by the number of items needed so, one by one, that’s what I did.

Then I added this number to…

And I added this number to…

How did I do this?…By using a formula, of course!
How I Made my Formula
1. I started of my formula with an equals symbol.
2. To do a normal addition formula, I would have clicked on the first cell I wanted in my sum, pressed the plus sign and clicked on the second cell I wanted in my formula. This wouldn’t have worked in this instance because, when I wanted to use relative cell referencing to copy this formula over to my other board games, it wouldn’t have worked for the columns I wanted it to. Therefore, I had to use absolute cell referencing in the price column so that the board game column would change when I copied the formula but the price column would stay the same.
To do absolute cell referencing for the price column, each time I typed a cell which is in the price column into my formula, I had to type a dollar sign before each letter and number, for example:

The cell which I typed in has been selected in the corresponding colour.
3. After I typed in my first cell using absolute cell referencing, I pressed the multiplication symbol.

4. Then, because I didn’t have to use absolute cell referencing for the next cell, I simply clicked on it to add it to my formula.

5. I then pressed the plus sign, ready to put the next line into my formula. Now, I needed to put ALL of the corresponding prices and cells into my formula in exactly the same way as I have just showed you; there was no quick way about it!
It took me a while but here is the finished formula – it’s very long! 😀

Even though it’s long, don’t be intimidated by this formula, it consists of really basic elements; it looks fancy but it’s not the cleverest thing you can do on excel!

Once I had my formula, it was only a matter of adding data into the other board game columns and using relative cell referencing to find out how much all of the board games cost!

Working Out the Profit
So, it’s all very well that I know how much it costs to make a board game, but what about the profit? To work this out, I created another table…
1. To start off my table, I listed the board games down the side in a column.
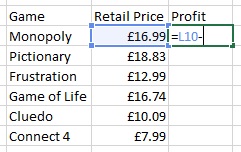
2. I didn’t need to put my cost to make in the table as I already had it somewhere else on the same spreadsheet so I put in the retail price.

3. Next, I added in a column for the profit.

4. To work out the profit, I needed to subtract the ‘cost to make’ from the retail price. This meant creating a subtraction formula. First of all, I needed to put an equals sign to start off my formula.

Then, I selected the Retail Price for monopoly as my first cell in the sum.

After that, I pressed the subtraction key as that is the operation I wanted to use.
To add my ‘cost to make’ to the formula, I had to look at the previous table I made and select the cell with the ‘cost to make’ for monopoly displayed.


Finally, I had to press enter to make the formula work and then type in a new formula for each board game. I couldn’t use relative cell referencing in this instance because the spreadsheet selected different cells to the ones I needed.

So, I knew the profit therefore I could work out whether I am making a decent amount of money on each board game. To do this, I needed to find the average, minimum and maximum cost. In one of my previous posts, I have explained all about how to do this so I won’t go into any detail.

I used conditional formatting and the average profit to show me how satisfactory each board game’s profit was.
I highlighted the cells I wanted to change colour and clicked on conditional formatting > highlight cells rules > greater than. This brought up a box.

Notice that I typed in the average profit and that ‘Green fill with dark green text’ was selected. This meant that, if any of my profits were over the average profit, they would turn green.

I then selected the cells which I wanted again, clicked conditional formatting > Highlight cells rules > Less than. Like before, this brought up a box.

I added in all of the correct information and the remaining cells were ,of course, selected red.
With some editing from the fill and border tool, my spreadsheet was complete!

For the final time in this topic,
Elsie signing out!
Embedding Spreadsheets into PowerPoint
Me again,
It’s great to be able to look at your data on a spreadsheet but what if you want to show others your work on a presentation? Let’s face it, you can do much more with PowerPoint presentation-wise than in excel!
Embedding our Spreadsheet
1. First things first, we are going to open PowerPoint on our desktop and open a blank presentation.
2. Next we are going to click on the ‘insert’ toolbar at the top of the screen and then ‘Object’. (Depending on which version of PowerPoint and excel you have, your buttons may look slightly different.)

3. A box a bit like this should pop up. If you want to create a completely new spreadsheet, select ‘Microsoft excel worksheet’.

If you want to use an existing spreadsheet which you have already created, then select ‘Create from file’ in the top left hand corner of the box and search for the document you want to open.
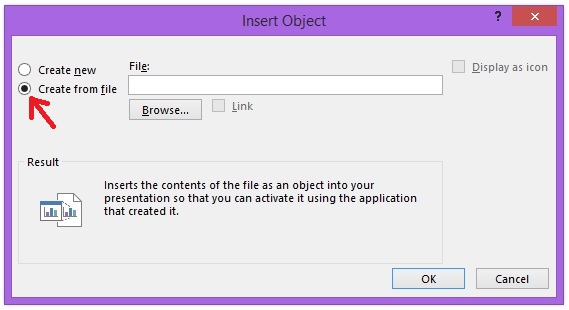
For this example we will be using an existing document.
4. Now, we will click ‘ok’ and the spreadsheet will be embedded into the PowerPoint presentation.

5. Now, you may be wondering why we couldn’t have just used the snipping tool however, if we double click on the embedded spreadsheet, we can edit it like in excel! That is the beauty of embedding spreadsheets into PowerPoint (or word – it works exactly the same!)
I hope this little tip has helped you with showing off your excel skills to others!
Elsie 🙂
Conditional Formatting
If one of the films has made less money than the overall average, it needs to be scrapped so a new film can earn more money next week. The conditional formatting function allows us to change the colour of cells IF certain things are true about them. We want to change the film red if it hasn’t earned enough and green if it has.
Successful Conditional Formatting
1. Highlight the cells which contain the overall total of the week for each movie.

2. Go onto the home tool bar and click on Conditional Formatting.

3. If you don’t have the 2013 version of excel then this may not work for you however this is how I did my conditional formatting. When we click on Conditional Formatting, a drop down menu should appear. Click on the option which says: ‘Highlight Cells Rules’ and then ‘Greater Than’. A box should appear like this:

4. Edit the text so that the cells which have a number higher than the average will turn green then do the same thing for cells which need to turn red except click on ‘Less Than’ at the start rather than ‘Greater Than’.

Bye for now,
Elsie 🙂
Real Life Example 2
Hi Guys,
Do you remember the Real Life Example 1 which I posted ages ago? Well, I kept my promise and I have posted another real life example using the table we have been looking at in my recent posts…
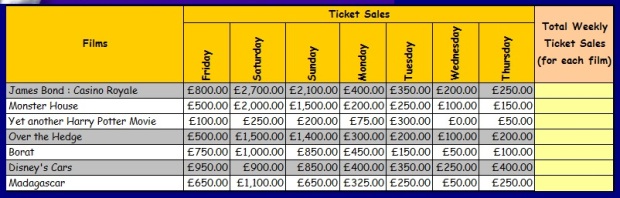
So, here we have some questions to answer about this filled in table which I showed you how to complete earlier.

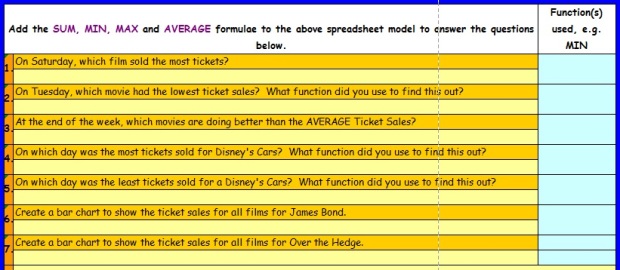
I’m going to talk you through these questions one by one to make sure that we completely understand AutoSum, min, max and average.
Question 1

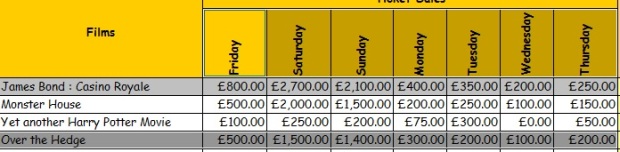
To work out this question, we need to look along the ‘max’ row and find the cell which is under the heading Saturday.

The maximum amount of money made by a film on Saturday is £2,700 – therefore we need to look at the Saturday column and see which film made £2,700.

The answer is:

Question 2

To work out this question, we need to look at the ‘min’ row and go along until we find the cell which is under Tuesday.

Now we need to look at the Tuesday column and see which movie sold £150.
The answer is:

Question 3

To work this question out, we need to look at the ‘average ticket sales’ row and find the cell which is under the ‘total weekly ticket sales (for each film)’. The number in this cell is £3,914.29.

Next we look down this column again and note down any movies which have a higher total weekly ticket sale than £3,914.29.

Then we simply look across to wee which movies had those total weekly ticket sales.
The answer is:

Question 4

To work out this question, we are going to need to use the AutoSum tool to work out the maximum amount of money made by Disney’s Cars.
First, we need to click on a box where we want our information displayed.

Then we need to click on the little arrow at the side of the AutoSum button and a drop down menu should appear. On this drop down menu, we click max. Make sure that the right cells are highlighted and press enter!


Now, we finally look along the row to find which film made £950.
The answer is:

Question 5

T work out this question, we do exactly the same as with the last question except we click on min in the drop down menu after we’ve clicked AutoSum.
The answer is:

Question 6

To work this question out, we need to highlight the information that we need from the table.

We next click on ‘Insert’ on the tool bar at the top of the screen and click on ‘bar chart’. This creates something like this…

To change the bar chart title, we simply double click on it and type our text.

Our bar chart is complete!
Question 7

To work this question out, we need to do exactly the same thing as before. We highlight our data (we highlight two pieces of data that aren’t joined at the same time by highlighting one and pressing ctrl to highlight the next).
Now we press insert in the tool bar and click bar chart. Our chart is complete!

Until next time,
Elsie
AutoSum
Guess who? 😉
AutoSum is such a cool and helpful function on excel – it’s another one of my favourites! It basically does all the work for you when you want to add something up. Here’s how it works…
So, here we have a table with a column of blanks in it.
To fill in those blanks, we need to add up the total money earned by each film in a week. We could do this manually by typing EVERY cell reference and EVERY addition sign however, by using AutoSum, the work is done much quicker!
Successfully Using AutoSum
AutoSum is one of the easiest things to use in excel so this will be a very short set of instructions.
1. All you do is click on the cell you want the answer to be displayed in and click the button AutoSum. The AutoSum button can be found on the home tool bar at the top of the screen.

The AutoSum button
2. The cells we want to add up should be highlighted. If they’re not, simply highlight the ones you want instead.

3. Press enter and the sum is complete!

Now drag down from the bottom right hand corner of the box and all of the column should be complete. AutoSum has done all the work for us.
Minimum, Maximum and Average
To work out the minimum, maximum and average of our data, we do exactly the same thing as before except for minor change (obviously). For this example, we will work out the minimum amount of money made in a day.

1. First we click on the box we want the minimum amount of money to be displayed in.

2. We then click on the little arrow pointing downwards on the right of the AutoSum button.

3. A drop down menu should appear with some options on it. Three of them are Min, Max and Average. For this example, we’re going to select min.
4. We make sure the correct boxes we want selected are selected.

5. Press enter! This process works for the maximum and average as well!
Here is the table filled in.
I hope this little tip helps you when using excel,
Elsie
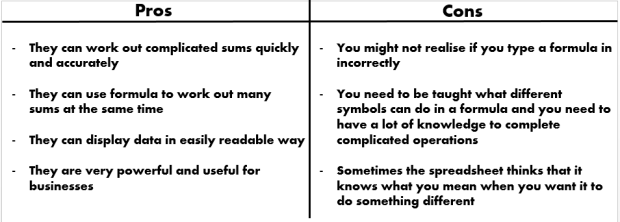
Spreadsheet Modelling: Pros and Cons
Spreadsheet modelling is, of course, very useful however it isn’t perfect.
Spreadsheet modelling helps so many people in many different ways. Without spreadsheets, well, I don’t know where we’d be! They are very easy to use and can work out very complicated sums/formulae/equations. It would be very hard to do the jobs we do and live how we live without spreadsheets. Businesses would have to work their finance out manually and that would take up lots of time, as well as there being a larger risk of mistakes. To be perfectly honest, spreadsheets are almost essential to us!
Even if they are very useful, spreadsheets can have their faults. It is very possible for someone to enter details wrongly into a spreadsheet and cause figures to be worked out incorrectly. Also, even though it’s not the spreadsheet’s fault, someone may enter a formula and it doesn’t do quite what was expected. Most of the faults with spreadsheets are because of human error.
Computer vs Human
Why are computers better for some things and humans better for others?
Computers are much more accurate than humans if they have the right data and have been programmed so they know what they are meant to be doing. If there is a long, complicated maths sum, chances are, a human would make a mistake and a computer would get it correct. The thing is, without humans to program computers, they would be absolutely useless. Computers can be good at what we want them to be good at because we can try to program them to do what we can’t. With humans and computers together, many more problems can be solved in a quicker time than humans.
On a spreadsheet, sometimes it tries to do something which is logical to the spreadsheet but not what we want. This means that humans are better for knowing what they want done but sometimes we need to rely on computers to do it for us. Obviously, programming would be used by the human so the computer would perform how we wanted it to however sometimes we might need to change that programming if it goes wrong. That’s another good thing about humans – they can recognise mistakes and work out how to correct them.
All in all, humans have made computers better at things which they find tricky but humans can do so much more than computers as we have brains and can think for ourselves.
I think this is a cause for some thought so I’m off to ponder!
Elsie
My Skills in Spreadsheet Modelling
So, how good am I really at spreadsheet modelling? It’s all very well that I post long tips on how to do spreadsheet modelling but have I remembered it all?
Before this topic, I had no knowledge of spreadsheet modelling whatsoever (which may surprise you!) so of course I was a little apprehensive. In contrary to my worries, I have picked up so much useful knowledge in the space of two lessons! I could explain what a cell reference was if someone asked me and tell them how to create a basic, working formula. I can tell absolute cell referncing from relative cell referencing (Absolute cell referencing is where you hold a cell reference in a formula when it’s copied down so it doesn’t change and relative cell referencing is where you drag down from the bottom right hand corner of a cell and it copies a sequence down) and so much more!
I would say that I remember information well and I can usually apply it in my work. I find it easy to focus when I am doing spreadsheet modelling because it can get a little complicated at points so I need to stay on task. I am enthusiastic about the topic so I think I try extra hard to do my best. Overall, I think I am confident with spreadsheet modelling and am definitely enjoying learning more about it!
Now, you thought the article had ended but I’ve actually created a little quiz for you to try out! Have you remembered what you’ve read? Click on this link to see the quiz I’ve made 🙂
https://www.onlinequizcreator.com/spreadsheet-modelling/quiz-161726
Have fun and post your scores!
Elsie
How Have Spreadsheets Impacted on Society?
So, a big question:
How have spreadsheets impacted on society?
Many people rely on spreadsheets to store data or work out something for them. I think that can be a good and bad thing, depending on the way you look at it. Spreadsheets are widely used in our modernising world. They are a very useful and helpful tool for businesses and are very simple to use however, this means that we rely on them for a lot of things. Are we relying on technology too much? For instance, if a computer storing somebody’s spreadsheet with their financial details on it gets a virus and the spreadsheet is lost, they would have it create it again. They may not remember all the details of it but, without that spreadsheet, this person may spend too much money and cause problems for themselves which would never have happened if they still had the spreadsheet. Also, if someone forgets to save a spreadsheet in a big business, they could be using an old spreadsheet to work out their current finances. They may not realise that they don’t have as much money as the spreadsheet and overspend, they may not realise that they have to pay more employees than stated on the spreadsheet or they might order more parts to make something than they actually need.
All of these problems seem to relate to money which is not good for anyone; if someone looses money because of a spreadsheet, they can’t just claim it back as if it was stolen. It’s gone until they earn it back. The examples I have used about people using their money are the fault of the people or a person (a person would have made the virus for the computer to get it in my first example) so we can’t really blame spreadsheets if something goes wrong. If information is entered incorrectly, it is again a person’s fault. Most problems are due to human error.
Even though I have just highlighted some reasons why we shouldn’t always rely on spreadsheets to do things for us, they are amazingly useful! Most of the time, there are no problems with the usage of spreadsheets, they store the right amount of data and everyone is happy. They are very helpful for many different things and, without them, we would make many, many more mistakes than we are currently. I predict that EVERY business uses a spreadsheet for something, even if it’s not working out their balance. Also, what would be the point of learning how to use spreadsheets at school if we weren’t expected to use them in later life? Just like they teach us English or maths, it’s important that we know how to use vital technology in our ever developing world.
I hope you’ve had fun reading this!
Elsie
